US Data Jobs Prediction & Analysis

- Developed backward-stepwise regression model to predict and visually analyzed data based job roles in US based on dataset of 4 job roles of previous 2 years attaining accuracy of 94.64% with result based impact map of data jobs using Python
- Trained dataset with regression analysis, used elastic net alpha to plot the validation error, observed collinearity and considered interaction terms leading to final tuned model with minimum mean squared error of 28.82%
- Created pie-charts, boxplots, bar-plots, point-plots, heatmaps and wordmap for processed datasets of Data Scientists, Data Analysts, Data Engineers and Business Analysts finding out highest paying job roles/job description in different locations and most used keywords
- Platform : Jupyter Notebook
- Programming Languages : Python
- Python Libraries : numpy, pandas, matplotlib, plotly, seaborn, numpy, scipy, statsmodels, sklearn, math, wordcloud
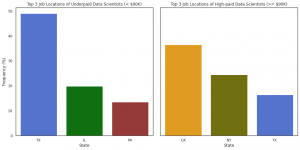
Bar Plot of Underpaid and High-paid Data Scientists in US
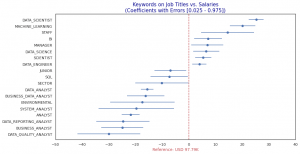
Job Titles vs Salaries Errorbar
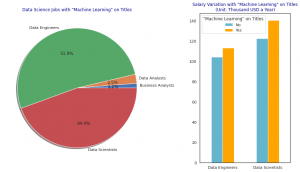
Salary Variation with “Machine Learning” on Title
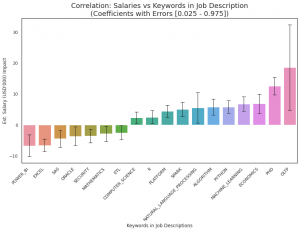
Salaries vs Keywords Barplot
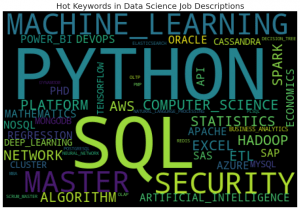
Wordmap of Hot Keywords in DS Job Descriptions
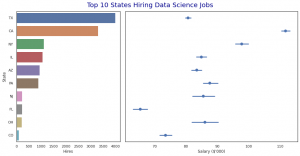
Bar Plot of Top 10 States Hiring Data Scientist
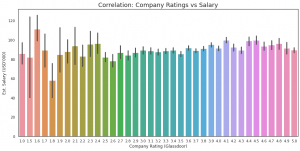
Coefficient Bar of Salary Performance against Average
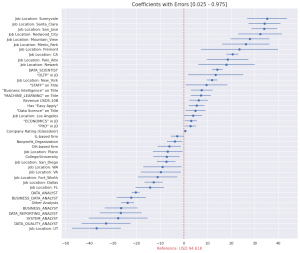
Data Science Job Salary Impact Map (Final Regression Result)